If you want true management dashboards for Sage ACT!, then you want TopLine Dash.
TopLine Dash is a powerful and easy-to-use dashboard for Sage ACT! The dashboard wizard guides you through setup so that you create your dashboard parameters and filters in minutes.
- Customizable Views: Add any database fields to your list views. Quickly save or reload your favorite dashboards. View opportunities and activities side-by-side. Copy or drag and drop dashboard panels and columns. Select different users for each panel. Move the legend as needed.
- Contact Details: Preview an editable contact layout by clicking on any lists of activities, opportunities, queries, histories, notes or products.
- Calendar: View and edit one or more daily, weekly or monthly calendars.
- Activities: Create customized activity lists or drill-down pie or bar graphs.
- Opportunities: Create customized opportunity lists or drill-down graphs, auto-calculate counts, gross margins, weighted totals and actual totals. Create follow-up activities directly from your pipeline report.
- Contact Lists: List your most important queries of contacts and edit them.
- Histories: View, filter and sort by history types and create history summary drill-down graphs. Right click to email history items.
- Products: View your selected products by sales stages, date range in a list or drill-down graph.
- Queries: Perform powerful opportunity and contact query lists and corresponding graphical views.
- Filtering: Filter by date type, activity type, regarding keyword, sales stage, process, group or query.
- Sorting: Sort by any selected field in your database including: date, priority, regarding, details, ID/status, city, state, probability, amount, stages, etc.
- Sum/Total: Sum/Total for any numeric or currency field in a dashboard list view.
- Interactive: Update the dashboard by selecting filters and sorting on the fly. Update multiple opportunities and activities simultaneously. Create look-ups from your notes, history, activity, opportunity or contact lists. Edit field values in contact lists and contact details.
- Reporting: Print your favorite dashboard panels as a PDF and share with others. Create read-only dashboards. Email selected histories.
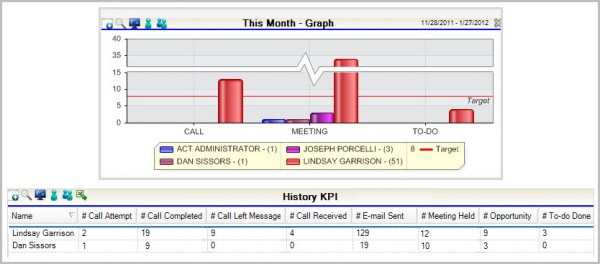
- Key Performance Indicators (KPIs): View and filter your sales metrics on activities, histories or opportunities, e.g., number of calls, meetings, to-dos, emails, quotes, new opportunities, calculates win/lose ratios, average sales and total sales for selected users and more.
- What’s New Report: View the last synchronization, new contacts, histories, notes, opportunities and activities for each user.
- Export to Excel: Export activities, notes, histories, opportunities, contacts and KPI statistics to Excel.
- Centralize and organize all key activities, opportunities, histories, notes and contacts in interactive and graphical dashboard views.
- Align opportunities with activities to ensure proper follow-up.
- Manage your database — Realign territories. Reschedule multiple activities or opportunities at once. Edit contact records and histories.
- Communicate faster by emailing one or more activities, or histories directly from the dashboard.
- Preview contact details. The drill-down links activities or opportunities directly to the contact details allowing you to easily update your database.
- Create follow-up activities from your pipeline list.
- Compare, analyze and drill down on graphical activity, history, opportunity, product or query graphs (including sum and average).
- Monitor and quantify sales performance with key performance indicator (KPI) statistics.
- Set targets for activity and opportunity levels to identify gaps and adjust sales plans.
- Analyze your pipeline by product using targeted groups such as customers or prospects.
- View multiple ACT! calendars inside the dashboard.
- Choose from many powerful dashboard templates and easily customize your own dashboards using our Dashboard Wizard. Drag and drop panels to move them.
- Share your dashboard as a report in PDF format.
- Export any list to MS Excel.
- Automate your dashboard reporting with TopLine Dash Alerts.
Contact us today to set up a trial or to purchase and we’ll give you the power to manage your business. Or call 781-606-0433 and ask for the Chief Problem Solver.
